> ## Documentation Index
> Fetch the complete documentation index at: https://docs.vectrade.io/llms.txt
> Use this file to discover all available pages before exploring further.
# Market Data & Analytics
> Complete guide to VTrade's market data infrastructure — browse 160+ instruments across six asset classes, conduct deep fundamental and technical research on individual securities, and leverage professional-grade analytics tools for portfolio optimization.
# Market Data & Analytics
VTrade provides comprehensive market data coverage and professional-grade analytics tools designed to support every stage of the investment decision process — from initial screening and idea generation, through deep fundamental research, to ongoing portfolio risk management and optimization.
***
## Market Overview
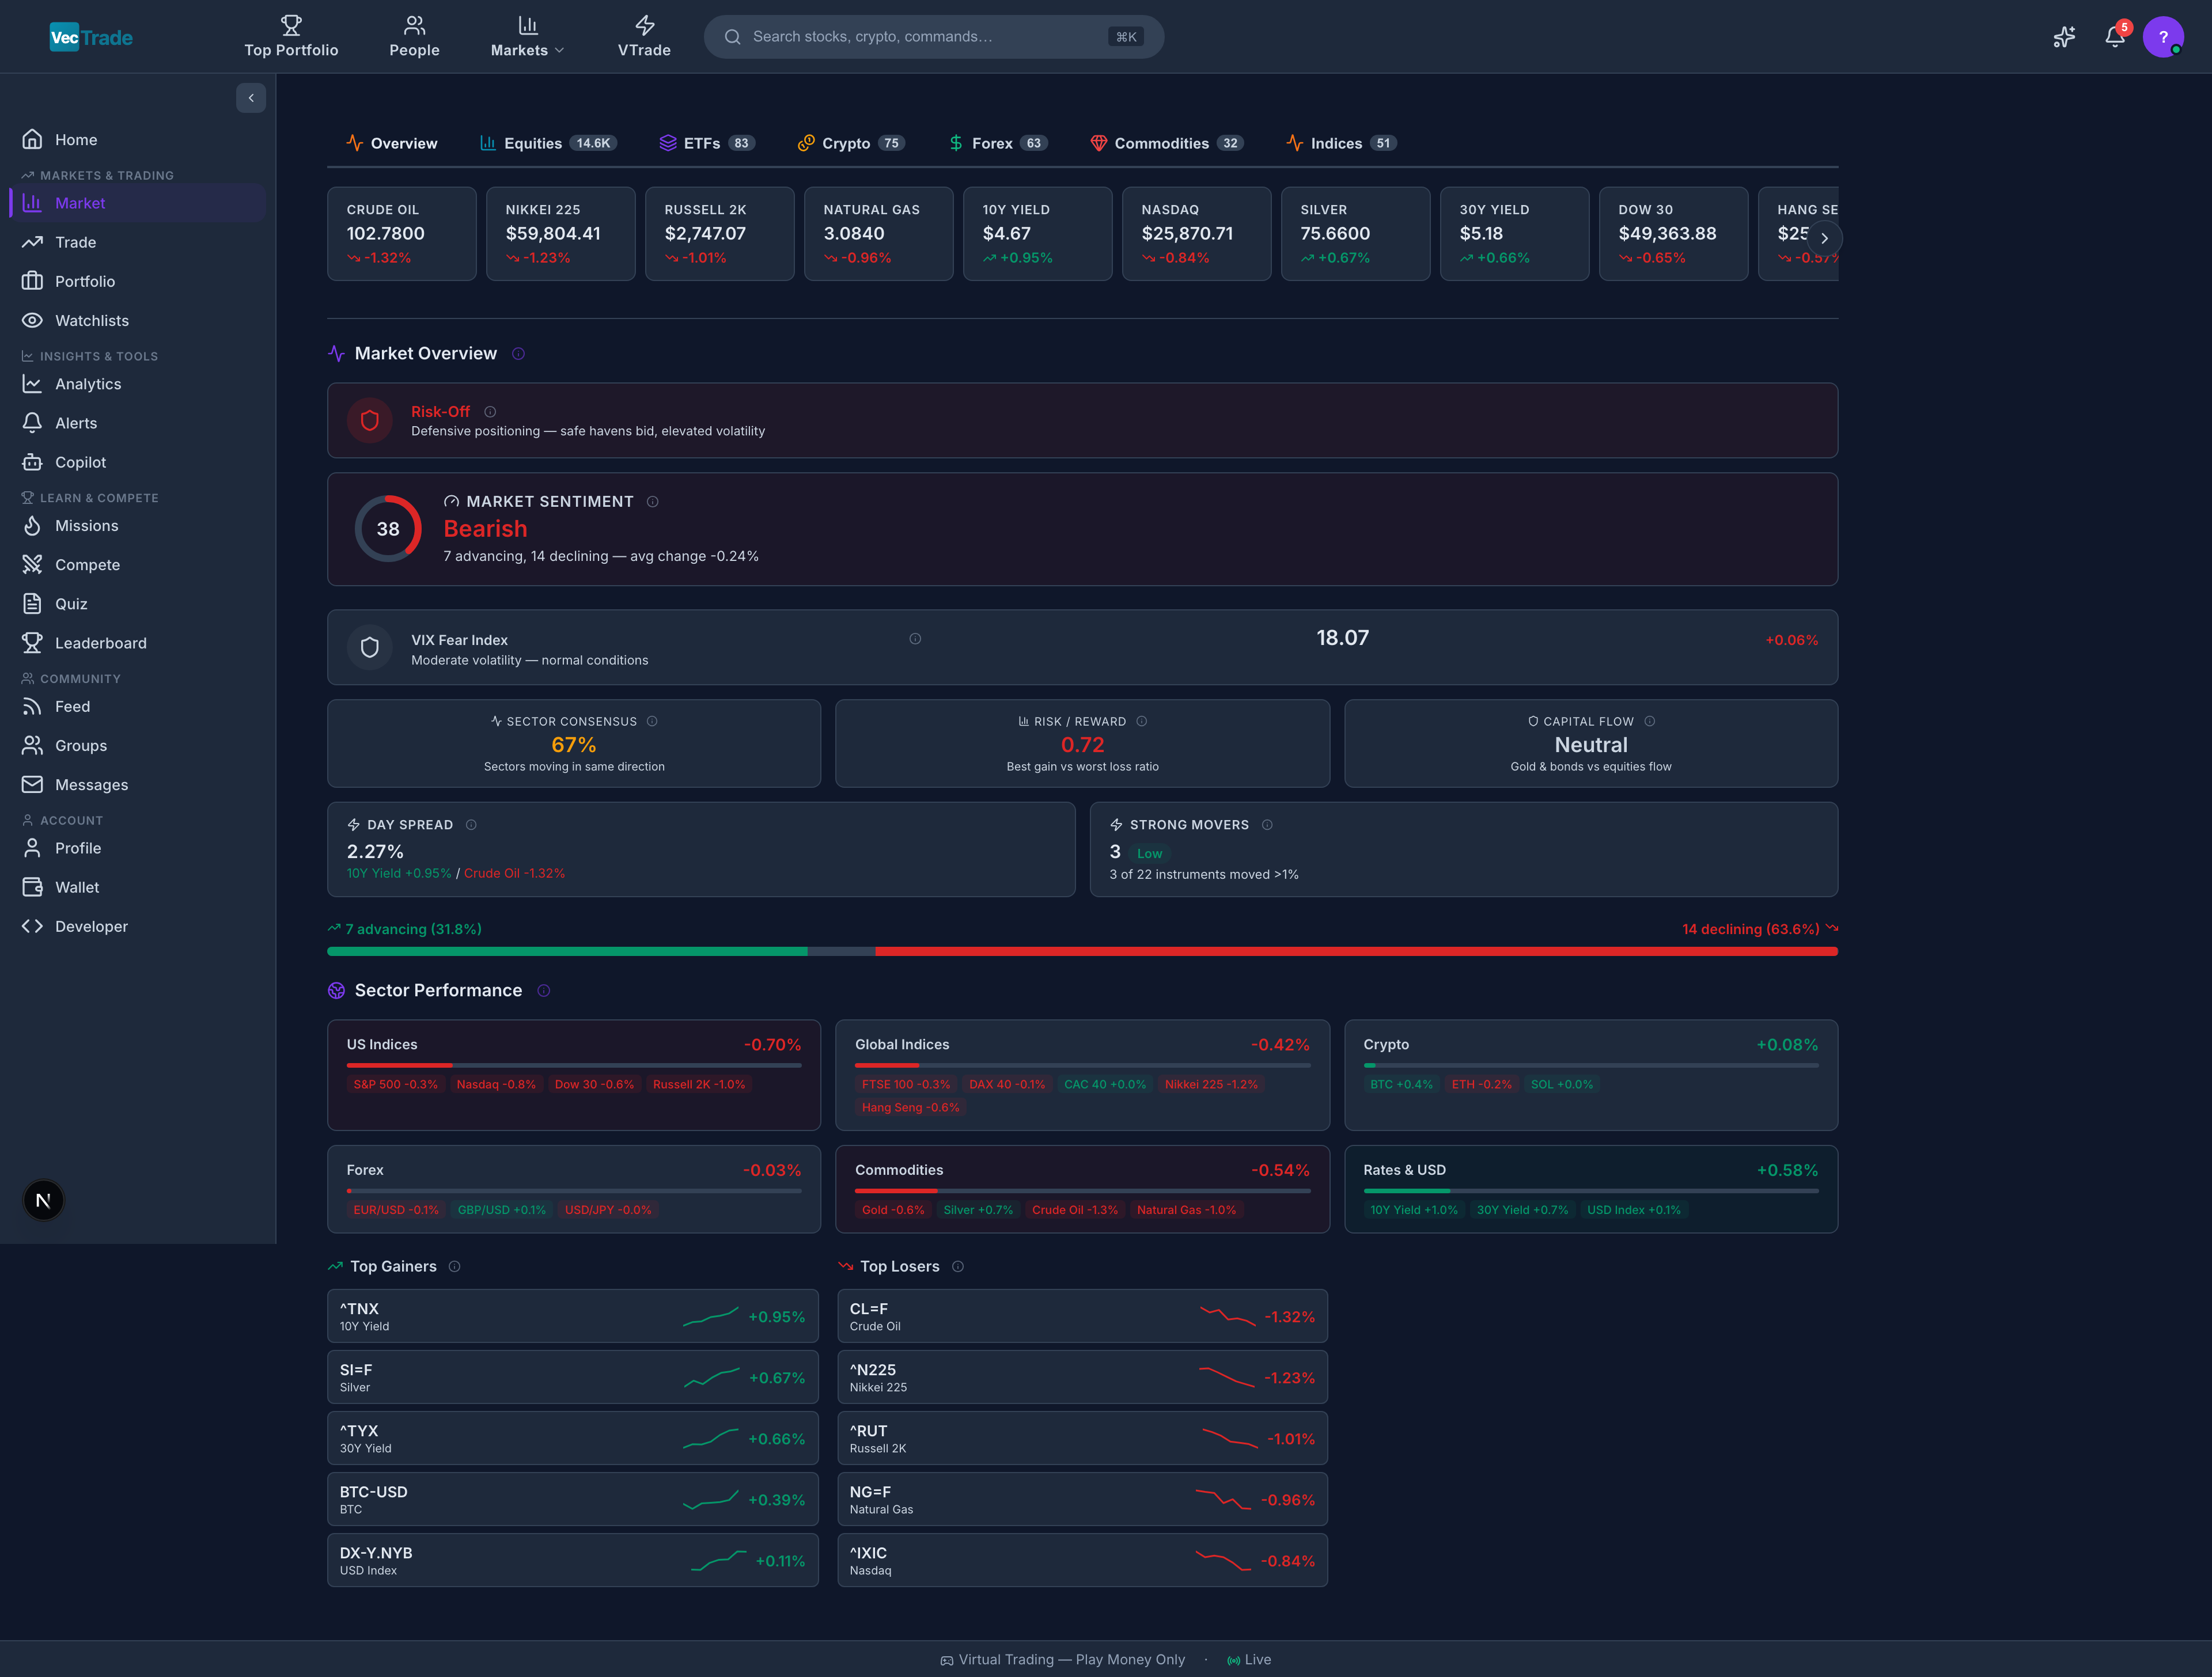 Navigate to **VTrade → Market** from the left sidebar for a real-time snapshot of global market conditions.
### Global Ticker Strip
A persistent horizontal ribbon at the top of the Market page displays 24 benchmark instruments updating in real-time:
| Category | Instruments Shown |
| --------------------- | -------------------------------------------------------- |
| US Indices | S\&P 500, NASDAQ Composite, Dow Jones Industrial Average |
| International Indices | FTSE 100, DAX 40, Nikkei 225, Hang Seng |
| Currencies | EUR/USD, GBP/USD, USD/JPY, USD/CNY |
| Crypto | BTC-USD, ETH-USD, SOL-USD |
| Commodities | Gold (XAU/USD), Crude Oil (WTI), Natural Gas |
| Rates | US 10-Year Treasury Yield, US 30-Year Treasury Yield |
Each ticker shows: symbol, current price, and change % with color coding (green = positive, red = negative).
### Overview Dashboard
The default Market tab provides a consolidated view of current conditions:
**Market Breadth Indicator:**
* Displays the ratio of advancing vs. declining securities across major US exchanges
* Visual bar chart showing the advance/decline line
* Breadth above 2:1 suggests strong bullish momentum; below 1:2 suggests broad selling pressure
**Sentiment Gauge:**
* A semicircular dial indicating aggregate market sentiment
* Scale ranges from Extreme Fear → Fear → Neutral → Greed → Extreme Greed
* Derived from multiple inputs: put/call ratio, VIX level, market breadth, new highs vs. new lows, and social media sentiment analysis
**Top Movers (Three-Column Layout):**
| Column | Content |
| --------------- | -------------------------------------------------------------- |
| **Top Gainers** | 10 instruments with highest positive % change today |
| **Top Losers** | 10 instruments with largest negative % change today |
| **Most Active** | 10 instruments with highest trading volume relative to average |
**Sector Heatmap:**
* Color-coded tile grid with each tile representing a GICS sector
* Tile size proportional to sector's total market capitalization
* Color intensity indicates magnitude of daily performance
* Green = positive sector return; Red = negative sector return
* Hover for precise percentage and dollar contribution to the market
**Volatility Spotlight (VIX):**
* Current VIX level with historical context
* Classification labels: Low (\< 15), Moderate (15–20), Elevated (20–30), High (30–40), Extreme (> 40)
* 30-day VIX chart showing volatility trend
***
## Asset Class Tabs
The Market page features dedicated tabs for each tradable asset class. Each tab presents a comprehensive sortable table with asset-class-specific columns.
### Equities
Navigate to **VTrade → Market** from the left sidebar for a real-time snapshot of global market conditions.
### Global Ticker Strip
A persistent horizontal ribbon at the top of the Market page displays 24 benchmark instruments updating in real-time:
| Category | Instruments Shown |
| --------------------- | -------------------------------------------------------- |
| US Indices | S\&P 500, NASDAQ Composite, Dow Jones Industrial Average |
| International Indices | FTSE 100, DAX 40, Nikkei 225, Hang Seng |
| Currencies | EUR/USD, GBP/USD, USD/JPY, USD/CNY |
| Crypto | BTC-USD, ETH-USD, SOL-USD |
| Commodities | Gold (XAU/USD), Crude Oil (WTI), Natural Gas |
| Rates | US 10-Year Treasury Yield, US 30-Year Treasury Yield |
Each ticker shows: symbol, current price, and change % with color coding (green = positive, red = negative).
### Overview Dashboard
The default Market tab provides a consolidated view of current conditions:
**Market Breadth Indicator:**
* Displays the ratio of advancing vs. declining securities across major US exchanges
* Visual bar chart showing the advance/decline line
* Breadth above 2:1 suggests strong bullish momentum; below 1:2 suggests broad selling pressure
**Sentiment Gauge:**
* A semicircular dial indicating aggregate market sentiment
* Scale ranges from Extreme Fear → Fear → Neutral → Greed → Extreme Greed
* Derived from multiple inputs: put/call ratio, VIX level, market breadth, new highs vs. new lows, and social media sentiment analysis
**Top Movers (Three-Column Layout):**
| Column | Content |
| --------------- | -------------------------------------------------------------- |
| **Top Gainers** | 10 instruments with highest positive % change today |
| **Top Losers** | 10 instruments with largest negative % change today |
| **Most Active** | 10 instruments with highest trading volume relative to average |
**Sector Heatmap:**
* Color-coded tile grid with each tile representing a GICS sector
* Tile size proportional to sector's total market capitalization
* Color intensity indicates magnitude of daily performance
* Green = positive sector return; Red = negative sector return
* Hover for precise percentage and dollar contribution to the market
**Volatility Spotlight (VIX):**
* Current VIX level with historical context
* Classification labels: Low (\< 15), Moderate (15–20), Elevated (20–30), High (30–40), Extreme (> 40)
* 30-day VIX chart showing volatility trend
***
## Asset Class Tabs
The Market page features dedicated tabs for each tradable asset class. Each tab presents a comprehensive sortable table with asset-class-specific columns.
### Equities
 **Coverage:** 40+ individual equities across 5 global exchanges:
| Exchange | Region | Example Tickers |
| ------------ | -------------- | ---------------------------------------------------- |
| NASDAQ | United States | AAPL, MSFT, NVDA, TSLA, AMZN, GOOGL, META, AMD, NFLX |
| NYSE | United States | JPM, BAC, JNJ, PG, KO, DIS, V, MA |
| LSE (London) | United Kingdom | BARC.L, HSBA.L, BP.L, AZN.L |
| TSE (Tokyo) | Japan | 7203.T (Toyota), 9984.T (SoftBank), 6758.T (Sony) |
| KOSDAQ | South Korea | 005930.KS (Samsung), 000660.KS (SK Hynix) |
**Table Columns:** Symbol, Name, Exchange, Price, Change %, Volume, Market Cap, P/E, 52W Range, Sector.
### ETFs
**Coverage:** 40+ individual equities across 5 global exchanges:
| Exchange | Region | Example Tickers |
| ------------ | -------------- | ---------------------------------------------------- |
| NASDAQ | United States | AAPL, MSFT, NVDA, TSLA, AMZN, GOOGL, META, AMD, NFLX |
| NYSE | United States | JPM, BAC, JNJ, PG, KO, DIS, V, MA |
| LSE (London) | United Kingdom | BARC.L, HSBA.L, BP.L, AZN.L |
| TSE (Tokyo) | Japan | 7203.T (Toyota), 9984.T (SoftBank), 6758.T (Sony) |
| KOSDAQ | South Korea | 005930.KS (Samsung), 000660.KS (SK Hynix) |
**Table Columns:** Symbol, Name, Exchange, Price, Change %, Volume, Market Cap, P/E, 52W Range, Sector.
### ETFs
 **Coverage:** 37 exchange-traded funds organized by category:
| Category | Fund Count | Examples |
| ------------- | ---------- | ------------------------------------------------------ |
| Index | 6 | SPY, QQQ, IWM, DIA, VTI, VOO |
| Sector | 11 | XLK, XLF, XLE, XLV, XLI, XLC, XLRE, XLB, XLU, XLP, XLY |
| Thematic | 5 | ARKK, ARKG, BOTZ, HACK, TAN |
| Fixed Income | 5 | TLT, IEF, SHY, HYG, LQD |
| Commodity | 4 | GLD, SLV, USO, UNG |
| International | 4 | EFA, VWO, FXI, EWJ |
| Dividend | 2 | VYM, SCHD |
**Table Columns:** Symbol, Name, Category, Price, Change %, AUM (Assets Under Management), Expense Ratio, Yield, Volume.
### Cryptocurrencies
**Coverage:** 37 exchange-traded funds organized by category:
| Category | Fund Count | Examples |
| ------------- | ---------- | ------------------------------------------------------ |
| Index | 6 | SPY, QQQ, IWM, DIA, VTI, VOO |
| Sector | 11 | XLK, XLF, XLE, XLV, XLI, XLC, XLRE, XLB, XLU, XLP, XLY |
| Thematic | 5 | ARKK, ARKG, BOTZ, HACK, TAN |
| Fixed Income | 5 | TLT, IEF, SHY, HYG, LQD |
| Commodity | 4 | GLD, SLV, USO, UNG |
| International | 4 | EFA, VWO, FXI, EWJ |
| Dividend | 2 | VYM, SCHD |
**Table Columns:** Symbol, Name, Category, Price, Change %, AUM (Assets Under Management), Expense Ratio, Yield, Volume.
### Cryptocurrencies
 **Coverage:** 23 cryptocurrency tokens:
| Category | Tokens |
| ---------------- | ---------------------------------------------- |
| Layer 1 | BTC, ETH, SOL, ADA, AVAX, DOT, ATOM, NEAR, APT |
| DeFi | UNI, AAVE, MKR, CRV, LDO |
| Exchange Tokens | BNB, FTT |
| Meme / Community | DOGE, SHIB, PEPE |
| Layer 2 | MATIC, ARB, OP |
| Infrastructure | LINK |
**Trading Hours:** 24/7/365 — crypto markets never close.
**Table Columns:** Symbol, Name, Category, Price, Change % (24h), Market Cap, Volume (24h), Circulating Supply, All-Time High.
### Forex
**Coverage:** 23 cryptocurrency tokens:
| Category | Tokens |
| ---------------- | ---------------------------------------------- |
| Layer 1 | BTC, ETH, SOL, ADA, AVAX, DOT, ATOM, NEAR, APT |
| DeFi | UNI, AAVE, MKR, CRV, LDO |
| Exchange Tokens | BNB, FTT |
| Meme / Community | DOGE, SHIB, PEPE |
| Layer 2 | MATIC, ARB, OP |
| Infrastructure | LINK |
**Trading Hours:** 24/7/365 — crypto markets never close.
**Table Columns:** Symbol, Name, Category, Price, Change % (24h), Market Cap, Volume (24h), Circulating Supply, All-Time High.
### Forex
 **Coverage:** 21 currency pairs:
| Category | Pairs |
| ---------------- | ------------------------------------------------------------- |
| Majors | EUR/USD, GBP/USD, USD/JPY, USD/CHF, AUD/USD, USD/CAD, NZD/USD |
| Crosses | EUR/GBP, EUR/JPY, GBP/JPY, AUD/JPY, EUR/CHF |
| Asian | USD/HKD, USD/SGD, USD/KRW, USD/INR |
| Emerging Markets | USD/MXN, USD/ZAR, USD/BRL, USD/TRY, USD/PLN |
**Trading Hours:** 24 hours per day, 5 days per week (Sunday 5:00 PM ET – Friday 5:00 PM ET).
**Table Columns:** Pair, Bid, Ask, Spread (pips), Change %, Day Range, Session (Sydney/Tokyo/London/New York).
### Commodities
**Coverage:** 21 currency pairs:
| Category | Pairs |
| ---------------- | ------------------------------------------------------------- |
| Majors | EUR/USD, GBP/USD, USD/JPY, USD/CHF, AUD/USD, USD/CAD, NZD/USD |
| Crosses | EUR/GBP, EUR/JPY, GBP/JPY, AUD/JPY, EUR/CHF |
| Asian | USD/HKD, USD/SGD, USD/KRW, USD/INR |
| Emerging Markets | USD/MXN, USD/ZAR, USD/BRL, USD/TRY, USD/PLN |
**Trading Hours:** 24 hours per day, 5 days per week (Sunday 5:00 PM ET – Friday 5:00 PM ET).
**Table Columns:** Pair, Bid, Ask, Spread (pips), Change %, Day Range, Session (Sydney/Tokyo/London/New York).
### Commodities
 **Coverage:** 20 commodity futures:
| Category | Contracts |
| ----------------- | ---------------------------------------------------------------- |
| Precious Metals | Gold (XAU), Silver (XAG), Platinum, Palladium |
| Energy | Crude Oil (WTI), Brent Crude, Natural Gas, Heating Oil, Gasoline |
| Industrial Metals | Copper, Aluminum, Zinc, Nickel, Iron Ore |
| Agriculture | Corn, Wheat, Soybeans, Coffee, Sugar, Cotton |
**Table Columns:** Symbol, Name, Category, Price, Change %, Volume, Open Interest, Contract Expiry.
### Indices
**Coverage:** 20 commodity futures:
| Category | Contracts |
| ----------------- | ---------------------------------------------------------------- |
| Precious Metals | Gold (XAU), Silver (XAG), Platinum, Palladium |
| Energy | Crude Oil (WTI), Brent Crude, Natural Gas, Heating Oil, Gasoline |
| Industrial Metals | Copper, Aluminum, Zinc, Nickel, Iron Ore |
| Agriculture | Corn, Wheat, Soybeans, Coffee, Sugar, Cotton |
**Table Columns:** Symbol, Name, Category, Price, Change %, Volume, Open Interest, Contract Expiry.
### Indices
 **Coverage:** 20 global market benchmarks:
| Region | Indices |
| ------------ | ------------------------------------------------------------- |
| Americas | S\&P 500, NASDAQ Composite, Dow Jones, Russell 2000, S\&P/TSX |
| Europe | FTSE 100, DAX 40, CAC 40, Euro Stoxx 50, IBEX 35 |
| Asia-Pacific | Nikkei 225, Hang Seng, Shanghai Composite, KOSPI, ASX 200 |
| Volatility | VIX (CBOE Volatility Index) |
| Rates | US 10-Year Yield, US 30-Year Yield, US 2-Year Yield |
**Table Columns:** Index, Region, Level, Change %, Change (pts), YTD %, Session Status (Open/Closed).
Indices are viewable for research and analysis but not directly tradable. To gain index exposure, trade the corresponding ETF (e.g., SPY for S\&P 500, QQQ for NASDAQ 100).
***
## Stock Detail Pages
Clicking any instrument from the Market table, a watchlist, or a search result opens its comprehensive detail page. Stock pages feature 8 dedicated research tabs providing in-depth analysis.
**Coverage:** 20 global market benchmarks:
| Region | Indices |
| ------------ | ------------------------------------------------------------- |
| Americas | S\&P 500, NASDAQ Composite, Dow Jones, Russell 2000, S\&P/TSX |
| Europe | FTSE 100, DAX 40, CAC 40, Euro Stoxx 50, IBEX 35 |
| Asia-Pacific | Nikkei 225, Hang Seng, Shanghai Composite, KOSPI, ASX 200 |
| Volatility | VIX (CBOE Volatility Index) |
| Rates | US 10-Year Yield, US 30-Year Yield, US 2-Year Yield |
**Table Columns:** Index, Region, Level, Change %, Change (pts), YTD %, Session Status (Open/Closed).
Indices are viewable for research and analysis but not directly tradable. To gain index exposure, trade the corresponding ETF (e.g., SPY for S\&P 500, QQQ for NASDAQ 100).
***
## Stock Detail Pages
Clicking any instrument from the Market table, a watchlist, or a search result opens its comprehensive detail page. Stock pages feature 8 dedicated research tabs providing in-depth analysis.
 Above: The stock detail page for Apple Inc. (AAPL) — showing the interactive price chart, key trading statistics, fundamental snapshot, and the tab navigation system for deeper research.
 Above: The same comprehensive interface for NVIDIA Corporation (NVDA) — demonstrating that the analysis depth is consistent across all equities regardless of sector or market capitalization.
The interface is uniform across all securities — whether you are researching a mega-cap technology stock (AAPL, NVDA), a UK-listed bank (BARC.L), or a Korean semiconductor company (005930.KS), the same 8 research tabs and data depth are available.
### Accessing Stock Pages by Exchange
You can also browse stocks organized by their listing exchange. Each exchange page presents a comprehensive table sortable by price, change %, volume, market cap, P/E ratio, and sector. Click any row to navigate directly to the full stock detail page.
**NASDAQ — US Technology & Growth Equities:**
Above: The same comprehensive interface for NVIDIA Corporation (NVDA) — demonstrating that the analysis depth is consistent across all equities regardless of sector or market capitalization.
The interface is uniform across all securities — whether you are researching a mega-cap technology stock (AAPL, NVDA), a UK-listed bank (BARC.L), or a Korean semiconductor company (005930.KS), the same 8 research tabs and data depth are available.
### Accessing Stock Pages by Exchange
You can also browse stocks organized by their listing exchange. Each exchange page presents a comprehensive table sortable by price, change %, volume, market cap, P/E ratio, and sector. Click any row to navigate directly to the full stock detail page.
**NASDAQ — US Technology & Growth Equities:**
 **NYSE — US Blue-Chip & Dividend Equities:**
 **KOSDAQ — Korean Technology & Semiconductor Equities:**
 Each exchange view supports the same column sorting, search filtering, and click-to-navigate functionality. Use these views to discover instruments within a specific exchange ecosystem.
***
### Tab 1: Summary
Each exchange view supports the same column sorting, search filtering, and click-to-navigate functionality. Use these views to discover instruments within a specific exchange ecosystem.
***
### Tab 1: Summary
 The Summary tab is your starting point for any security, providing:
**Interactive Price Chart:**
* Candlestick chart with configurable timeframes (1min – 1W)
* Technical indicator overlays (SMA, EMA, Bollinger Bands, RSI, MACD, VWAP)
* Volume histogram
* Drawing tools (trend lines, Fibonacci, horizontals)
* Full-screen mode for detailed analysis
**Key Trading Statistics:**
| Statistic | Description |
| ----------------- | ----------------------------------- |
| Open | Today's opening price |
| Day High | Highest intraday price |
| Day Low | Lowest intraday price |
| Previous Close | Yesterday's final price |
| Volume | Shares traded today |
| Avg. Volume (20D) | 20-day average daily volume |
| 52-Week High | Highest price in trailing 12 months |
| 52-Week Low | Lowest price in trailing 12 months |
**Fundamental Snapshot:**
| Metric | Description |
| ---------------- | ------------------------------------------------------------- |
| Market Cap | Total shares outstanding × current price |
| Enterprise Value | Market cap + debt – cash (true company value) |
| P/E Ratio (TTM) | Price ÷ trailing-twelve-month earnings per share |
| Forward P/E | Price ÷ next-year consensus EPS estimate |
| PEG Ratio | P/E ÷ earnings growth rate (value relative to growth) |
| EPS (TTM) | Earnings per share, trailing twelve months |
| Revenue (TTM) | Total revenue, trailing twelve months |
| Profit Margin | Net income ÷ revenue |
| Dividend Yield | Annual dividend ÷ current price |
| Beta | Stock volatility relative to S\&P 500 (1.0 = market-matching) |
| Short Interest | Percentage of shares sold short |
**AI Composite Score:**
* VecTrade proprietary rating (0–100) combining technical, fundamental, and sentiment signals
* Broken down into component sub-scores with letter grades (A+ through F)
***
### Tab 2: Options
The Summary tab is your starting point for any security, providing:
**Interactive Price Chart:**
* Candlestick chart with configurable timeframes (1min – 1W)
* Technical indicator overlays (SMA, EMA, Bollinger Bands, RSI, MACD, VWAP)
* Volume histogram
* Drawing tools (trend lines, Fibonacci, horizontals)
* Full-screen mode for detailed analysis
**Key Trading Statistics:**
| Statistic | Description |
| ----------------- | ----------------------------------- |
| Open | Today's opening price |
| Day High | Highest intraday price |
| Day Low | Lowest intraday price |
| Previous Close | Yesterday's final price |
| Volume | Shares traded today |
| Avg. Volume (20D) | 20-day average daily volume |
| 52-Week High | Highest price in trailing 12 months |
| 52-Week Low | Lowest price in trailing 12 months |
**Fundamental Snapshot:**
| Metric | Description |
| ---------------- | ------------------------------------------------------------- |
| Market Cap | Total shares outstanding × current price |
| Enterprise Value | Market cap + debt – cash (true company value) |
| P/E Ratio (TTM) | Price ÷ trailing-twelve-month earnings per share |
| Forward P/E | Price ÷ next-year consensus EPS estimate |
| PEG Ratio | P/E ÷ earnings growth rate (value relative to growth) |
| EPS (TTM) | Earnings per share, trailing twelve months |
| Revenue (TTM) | Total revenue, trailing twelve months |
| Profit Margin | Net income ÷ revenue |
| Dividend Yield | Annual dividend ÷ current price |
| Beta | Stock volatility relative to S\&P 500 (1.0 = market-matching) |
| Short Interest | Percentage of shares sold short |
**AI Composite Score:**
* VecTrade proprietary rating (0–100) combining technical, fundamental, and sentiment signals
* Broken down into component sub-scores with letter grades (A+ through F)
***
### Tab 2: Options
 A complete options chain display for the selected security:
**Expiration Selector:**
* Dropdown listing all available expiration dates (weeklies and monthlies)
* Days-to-expiration (DTE) shown next to each date
* Filter: All, Weeklies Only, Monthlies Only
**Chain Layout (Split View):**
| Calls (Left) | Strike | Puts (Right) |
| ----------------------------------------------------------------- | ------------ | ----------------------------------------------------------------- |
| Last, Bid, Ask, Change, Volume, OI, IV, Delta, Gamma, Theta, Vega | Strike Price | Last, Bid, Ask, Change, Volume, OI, IV, Delta, Gamma, Theta, Vega |
**Visual Indicators:**
* In-the-money (ITM) contracts highlighted with a shaded background
* At-the-money (ATM) strike row emphasized with a border
* Volume heatmap — darker cells indicate higher relative volume
**Options Metrics Explained:**
| Greek | Interpretation |
| ----- | ---------------------------------------------------------------------- |
| Delta | Expected price change per \$1 move in the underlying |
| Gamma | Rate of change of delta (acceleration) |
| Theta | Daily time decay — how much value the option loses per day |
| Vega | Sensitivity to a 1% change in implied volatility |
| IV | Implied volatility — the market's expectation of future price movement |
***
### Tab 3: Financials
A complete options chain display for the selected security:
**Expiration Selector:**
* Dropdown listing all available expiration dates (weeklies and monthlies)
* Days-to-expiration (DTE) shown next to each date
* Filter: All, Weeklies Only, Monthlies Only
**Chain Layout (Split View):**
| Calls (Left) | Strike | Puts (Right) |
| ----------------------------------------------------------------- | ------------ | ----------------------------------------------------------------- |
| Last, Bid, Ask, Change, Volume, OI, IV, Delta, Gamma, Theta, Vega | Strike Price | Last, Bid, Ask, Change, Volume, OI, IV, Delta, Gamma, Theta, Vega |
**Visual Indicators:**
* In-the-money (ITM) contracts highlighted with a shaded background
* At-the-money (ATM) strike row emphasized with a border
* Volume heatmap — darker cells indicate higher relative volume
**Options Metrics Explained:**
| Greek | Interpretation |
| ----- | ---------------------------------------------------------------------- |
| Delta | Expected price change per \$1 move in the underlying |
| Gamma | Rate of change of delta (acceleration) |
| Theta | Daily time decay — how much value the option loses per day |
| Vega | Sensitivity to a 1% change in implied volatility |
| IV | Implied volatility — the market's expectation of future price movement |
***
### Tab 3: Financials
 Deep fundamental analysis with interactive financial statement data:
**Income Statement:**
* Revenue, COGS, Gross Profit, Operating Expenses, EBITDA, Operating Income, Net Income
* Toggle between Quarterly and Annual views
* Multi-year comparison (up to 10 years of annual data, 20 quarters)
* Year-over-year growth rates highlighted
**Balance Sheet:**
* Total Assets, Current Assets, Non-Current Assets
* Total Liabilities, Current Liabilities, Long-Term Debt
* Shareholder Equity, Retained Earnings, Book Value per Share
* Key ratios: Current Ratio, Debt-to-Equity, Quick Ratio
**Cash Flow Statement:**
* Operating Cash Flow, Capital Expenditures, Free Cash Flow
* Investing Activities, Financing Activities
* Dividends Paid, Share Buybacks
* Net Cash Change
**Interactive Visualizations:**
* **Revenue Sankey Diagram** — Flow chart showing revenue sources and how they convert to profit
* **EPS History Chart** — Quarterly EPS with analyst estimate bars (beats shown green, misses shown red)
* **Dividend History** — Payment timeline with yield calculation and growth rate CAGR
* **Margin Trends** — Line chart tracking gross, operating, and net margins over time
***
### Tab 4: Ownership
Deep fundamental analysis with interactive financial statement data:
**Income Statement:**
* Revenue, COGS, Gross Profit, Operating Expenses, EBITDA, Operating Income, Net Income
* Toggle between Quarterly and Annual views
* Multi-year comparison (up to 10 years of annual data, 20 quarters)
* Year-over-year growth rates highlighted
**Balance Sheet:**
* Total Assets, Current Assets, Non-Current Assets
* Total Liabilities, Current Liabilities, Long-Term Debt
* Shareholder Equity, Retained Earnings, Book Value per Share
* Key ratios: Current Ratio, Debt-to-Equity, Quick Ratio
**Cash Flow Statement:**
* Operating Cash Flow, Capital Expenditures, Free Cash Flow
* Investing Activities, Financing Activities
* Dividends Paid, Share Buybacks
* Net Cash Change
**Interactive Visualizations:**
* **Revenue Sankey Diagram** — Flow chart showing revenue sources and how they convert to profit
* **EPS History Chart** — Quarterly EPS with analyst estimate bars (beats shown green, misses shown red)
* **Dividend History** — Payment timeline with yield calculation and growth rate CAGR
* **Margin Trends** — Line chart tracking gross, operating, and net margins over time
***
### Tab 4: Ownership
 Comprehensive ownership structure analysis:
**Ownership Distribution Pie Chart:**
* Institutional investors (percentage and dollar value)
* Retail investors (individual shareholders)
* Insiders (executives, directors, 10%+ holders)
**Top Institutional Holders (Table):**
| Column | Data |
| ------------- | ------------------------------------------------ |
| Institution | Fund/firm name (e.g., Vanguard Group, BlackRock) |
| Shares Held | Number of shares owned |
| % Outstanding | Percentage of total shares |
| Value (\$) | Dollar value of position |
| Change | Increase/decrease vs. prior quarter filing |
| Filing Date | Most recent 13F filing date |
**Insider Transactions (Table):**
| Column | Data |
| ----------- | ----------------------------------- |
| Name | Insider name |
| Title | Role (CEO, CFO, Director, VP, etc.) |
| Transaction | Buy or Sell |
| Shares | Number of shares transacted |
| Price | Transaction price per share |
| Value (\$) | Total dollar value |
| Date | Transaction date |
| Remaining | Shares still held after transaction |
**Congressional Trading (if applicable):**
* Recent stock transactions by members of the US Congress
* Legislator name, party, chamber, transaction type, estimated value range, and disclosure date
***
### Tab 5: News
Comprehensive ownership structure analysis:
**Ownership Distribution Pie Chart:**
* Institutional investors (percentage and dollar value)
* Retail investors (individual shareholders)
* Insiders (executives, directors, 10%+ holders)
**Top Institutional Holders (Table):**
| Column | Data |
| ------------- | ------------------------------------------------ |
| Institution | Fund/firm name (e.g., Vanguard Group, BlackRock) |
| Shares Held | Number of shares owned |
| % Outstanding | Percentage of total shares |
| Value (\$) | Dollar value of position |
| Change | Increase/decrease vs. prior quarter filing |
| Filing Date | Most recent 13F filing date |
**Insider Transactions (Table):**
| Column | Data |
| ----------- | ----------------------------------- |
| Name | Insider name |
| Title | Role (CEO, CFO, Director, VP, etc.) |
| Transaction | Buy or Sell |
| Shares | Number of shares transacted |
| Price | Transaction price per share |
| Value (\$) | Total dollar value |
| Date | Transaction date |
| Remaining | Shares still held after transaction |
**Congressional Trading (if applicable):**
* Recent stock transactions by members of the US Congress
* Legislator name, party, chamber, transaction type, estimated value range, and disclosure date
***
### Tab 5: News
 Curated news feed filtered to the selected security:
Each article displays:
* **Headline** — Clickable link to full article
* **Source** — Publication name (Reuters, Bloomberg, CNBC, etc.)
* **Timestamp** — Publication date/time with relative indicator ("2 hours ago")
* **Sentiment Badge** — AI-classified sentiment:
* 🟢 **Bullish** — Positive implications for the stock
* 🔴 **Bearish** — Negative implications for the stock
* ⚪ **Neutral** — Informational, no clear directional bias
* **Summary** — Two-line excerpt of the key information
News items sorted chronologically (newest first) with infinite scroll pagination.
***
### Tab 6: Seasonals
Curated news feed filtered to the selected security:
Each article displays:
* **Headline** — Clickable link to full article
* **Source** — Publication name (Reuters, Bloomberg, CNBC, etc.)
* **Timestamp** — Publication date/time with relative indicator ("2 hours ago")
* **Sentiment Badge** — AI-classified sentiment:
* 🟢 **Bullish** — Positive implications for the stock
* 🔴 **Bearish** — Negative implications for the stock
* ⚪ **Neutral** — Informational, no clear directional bias
* **Summary** — Two-line excerpt of the key information
News items sorted chronologically (newest first) with infinite scroll pagination.
***
### Tab 6: Seasonals
 Statistical seasonal analysis based on historical price data:
**Monthly Performance Bar Chart:**
* 12 bars representing average return for each calendar month (based on 10-year history)
* Green bars = historically positive months; Red bars = historically negative months
* Standard deviation whiskers showing return dispersion
* Win rate label on each bar (e.g., "Jan: +2.3% avg, 70% positive")
**Seasonal Patterns:**
* "Best months" and "worst months" highlighted with confidence levels
* Notable recurring events (product launches, earnings cycles, dividend dates) annotated
* Year-over-year overlay comparison (this year vs. historical average)
***
### Tab 7: Filings
Statistical seasonal analysis based on historical price data:
**Monthly Performance Bar Chart:**
* 12 bars representing average return for each calendar month (based on 10-year history)
* Green bars = historically positive months; Red bars = historically negative months
* Standard deviation whiskers showing return dispersion
* Win rate label on each bar (e.g., "Jan: +2.3% avg, 70% positive")
**Seasonal Patterns:**
* "Best months" and "worst months" highlighted with confidence levels
* Notable recurring events (product launches, earnings cycles, dividend dates) annotated
* Year-over-year overlay comparison (this year vs. historical average)
***
### Tab 7: Filings
 Regulatory filing history from the SEC EDGAR database:
| Filing Type | Description | Frequency |
| ----------- | ------------------------------------------------------------- | --------------------- |
| **10-K** | Annual report — comprehensive business and financial overview | Annual |
| **10-Q** | Quarterly financial report | Quarterly |
| **8-K** | Current event disclosure (material events) | As needed |
| **DEF 14A** | Proxy statement (shareholder vote matters) | Annual |
| **13F** | Institutional investment manager holdings | Quarterly |
| **4** | Insider trading reports | As transactions occur |
| **S-1** | Registration statement (IPOs) | As needed |
Each filing entry shows: type badge, document title, filing date, and a direct link to the full document on SEC EDGAR.
***
### Tab 8: Profile
Regulatory filing history from the SEC EDGAR database:
| Filing Type | Description | Frequency |
| ----------- | ------------------------------------------------------------- | --------------------- |
| **10-K** | Annual report — comprehensive business and financial overview | Annual |
| **10-Q** | Quarterly financial report | Quarterly |
| **8-K** | Current event disclosure (material events) | As needed |
| **DEF 14A** | Proxy statement (shareholder vote matters) | Annual |
| **13F** | Institutional investment manager holdings | Quarterly |
| **4** | Insider trading reports | As transactions occur |
| **S-1** | Registration statement (IPOs) | As needed |
Each filing entry shows: type badge, document title, filing date, and a direct link to the full document on SEC EDGAR.
***
### Tab 8: Profile
 Comprehensive company background information:
| Field | Content |
| -------------------- | --------------------------------------------------------------------- |
| Business Description | Multi-paragraph overview of operations, products, and market position |
| Sector | GICS sector classification |
| Industry | GICS industry sub-classification |
| Sub-Industry | Granular industry classification |
| Headquarters | City, State/Province, Country |
| Founded | Year of incorporation |
| IPO Date | Date of initial public offering |
| Employees | Full-time headcount |
| CEO | Chief Executive Officer name |
| CFO | Chief Financial Officer name |
| Website | Official corporate URL |
| Phone | Investor relations contact |
| Fiscal Year End | Month when fiscal year closes |
**Key Executives Table:**
* Name, Title, Age, Tenure, Total Compensation (annual)
***
## Analytics Suite
Comprehensive company background information:
| Field | Content |
| -------------------- | --------------------------------------------------------------------- |
| Business Description | Multi-paragraph overview of operations, products, and market position |
| Sector | GICS sector classification |
| Industry | GICS industry sub-classification |
| Sub-Industry | Granular industry classification |
| Headquarters | City, State/Province, Country |
| Founded | Year of incorporation |
| IPO Date | Date of initial public offering |
| Employees | Full-time headcount |
| CEO | Chief Executive Officer name |
| CFO | Chief Financial Officer name |
| Website | Official corporate URL |
| Phone | Investor relations contact |
| Fiscal Year End | Month when fiscal year closes |
**Key Executives Table:**
* Name, Title, Age, Tenure, Total Compensation (annual)
***
## Analytics Suite
 Navigate to **VTrade → Analytics** for professional-grade portfolio analysis and market screening tools.
### Analytics Dashboard
The main analytics view provides a multi-panel dashboard:
**Performance Strip:**
* Total equity, daily P\&L, win rate, profit factor, Sharpe ratio — all visible without scrolling
**Equity Curve (Primary Chart):**
* Portfolio value over time with benchmark comparison overlay
* Timeframe selector: 1W, 1M, 3M, 6M, 1Y, All-Time
* Drawdown waterfall beneath the main curve
* High-water mark and recovery periods shaded
**Risk Metrics Panel:**
| Metric | Description | Your Value | Interpretation |
| ------------ | ------------------------------------------------------------- | ---------- | -------------------------------------- |
| VaR (95%) | Value at Risk — maximum expected daily loss at 95% confidence | Dynamic | Lower = more conservative |
| CVaR (95%) | Conditional VaR — average loss in the worst 5% of scenarios | Dynamic | Tail risk measure |
| Sharpe Ratio | Excess return per unit of total risk | Dynamic | > 1.0 good; > 2.0 excellent |
| Max Drawdown | Largest peak-to-trough portfolio decline | Dynamic | Capital preservation indicator |
| Beta | Portfolio sensitivity to S\&P 500 | Dynamic | \< 1.0 = defensive; > 1.0 = aggressive |
| Calmar Ratio | Annual return ÷ max drawdown | Dynamic | Risk/reward efficiency |
**Holdings Treemap:**
* Rectangular grid where each rectangle represents a position
* Rectangle size = position weight in portfolio
* Rectangle color = profitability (green = profit, red = loss, intensity = magnitude)
* Hover for: symbol, weight %, P\&L \$, P\&L %
**Sector Allocation Donut:**
* Interactive donut chart with sector breakdown
* Click a segment to filter the treemap to only that sector
**Correlation Matrix:**
* Heatmap grid showing pairwise correlations between all holdings
* Scale: -1.0 (perfectly inverse) to +1.0 (perfectly correlated)
* Helps identify diversification gaps (highly correlated positions)
**What-If Simulator:**
* Select a hypothetical new position (symbol, quantity, direction)
* Preview how it would change: portfolio beta, Sharpe ratio, sector allocation, correlation profile
* Useful for pre-trade risk assessment before committing capital
***
### Stock Screener
Navigate to **VTrade → Analytics** for professional-grade portfolio analysis and market screening tools.
### Analytics Dashboard
The main analytics view provides a multi-panel dashboard:
**Performance Strip:**
* Total equity, daily P\&L, win rate, profit factor, Sharpe ratio — all visible without scrolling
**Equity Curve (Primary Chart):**
* Portfolio value over time with benchmark comparison overlay
* Timeframe selector: 1W, 1M, 3M, 6M, 1Y, All-Time
* Drawdown waterfall beneath the main curve
* High-water mark and recovery periods shaded
**Risk Metrics Panel:**
| Metric | Description | Your Value | Interpretation |
| ------------ | ------------------------------------------------------------- | ---------- | -------------------------------------- |
| VaR (95%) | Value at Risk — maximum expected daily loss at 95% confidence | Dynamic | Lower = more conservative |
| CVaR (95%) | Conditional VaR — average loss in the worst 5% of scenarios | Dynamic | Tail risk measure |
| Sharpe Ratio | Excess return per unit of total risk | Dynamic | > 1.0 good; > 2.0 excellent |
| Max Drawdown | Largest peak-to-trough portfolio decline | Dynamic | Capital preservation indicator |
| Beta | Portfolio sensitivity to S\&P 500 | Dynamic | \< 1.0 = defensive; > 1.0 = aggressive |
| Calmar Ratio | Annual return ÷ max drawdown | Dynamic | Risk/reward efficiency |
**Holdings Treemap:**
* Rectangular grid where each rectangle represents a position
* Rectangle size = position weight in portfolio
* Rectangle color = profitability (green = profit, red = loss, intensity = magnitude)
* Hover for: symbol, weight %, P\&L \$, P\&L %
**Sector Allocation Donut:**
* Interactive donut chart with sector breakdown
* Click a segment to filter the treemap to only that sector
**Correlation Matrix:**
* Heatmap grid showing pairwise correlations between all holdings
* Scale: -1.0 (perfectly inverse) to +1.0 (perfectly correlated)
* Helps identify diversification gaps (highly correlated positions)
**What-If Simulator:**
* Select a hypothetical new position (symbol, quantity, direction)
* Preview how it would change: portfolio beta, Sharpe ratio, sector allocation, correlation profile
* Useful for pre-trade risk assessment before committing capital
***
### Stock Screener
 Navigate to **Analytics → Screener** for systematic stock discovery.
**Available Filter Criteria:**
| Filter Category | Parameters |
| -------------------- | ------------------------------------------------------------------------------------------------------------------------------------------------------------ |
| **Sector** | Technology, Healthcare, Financials, Energy, Consumer Discretionary, Consumer Staples, Industrials, Materials, Utilities, Real Estate, Communication Services |
| **Market Cap** | Nano (\<$50M), Micro ($50M–$300M), Small ($300M–$2B), Mid ($2B–$10B), Large ($10B–$200B), Mega (>$200B) |
| **P/E Ratio** | Custom range (e.g., 5–20 for value, 30+ for growth) |
| **Forward P/E** | Custom range |
| **PEG Ratio** | Custom range (\< 1.0 = undervalued relative to growth) |
| **Price Change (%)** | Daily, weekly, monthly, or YTD change range |
| **RSI (14)** | Custom range (\< 30 = oversold, > 70 = overbought) |
| **Dividend Yield** | Minimum yield percentage |
| **Beta** | Custom range (0.5–1.5 typical) |
| **Revenue Growth** | Year-over-year growth rate range |
| **EPS Growth** | Year-over-year earnings growth range |
| **Profit Margin** | Minimum net profit margin |
| **Debt/Equity** | Maximum leverage ratio |
| **Short Interest** | Percentage range of shares sold short |
| **Analyst Rating** | Strong Buy, Buy, Hold, Sell, Strong Sell |
| **52-Week Position** | Within X% of high or low |
**Results Table:**
Matching instruments display in a comprehensive sortable table with all filter fields as columns, plus: current price, AI score, and action buttons (Trade, Add to Watchlist, View Detail).
**Saved Screens:**
Save frequently used filter combinations for one-click access. Examples: "Value Stocks," "High-Growth Tech," "Oversold Dividend Payers."
***
### Performance Calendar
Navigate to **Analytics → Screener** for systematic stock discovery.
**Available Filter Criteria:**
| Filter Category | Parameters |
| -------------------- | ------------------------------------------------------------------------------------------------------------------------------------------------------------ |
| **Sector** | Technology, Healthcare, Financials, Energy, Consumer Discretionary, Consumer Staples, Industrials, Materials, Utilities, Real Estate, Communication Services |
| **Market Cap** | Nano (\<$50M), Micro ($50M–$300M), Small ($300M–$2B), Mid ($2B–$10B), Large ($10B–$200B), Mega (>$200B) |
| **P/E Ratio** | Custom range (e.g., 5–20 for value, 30+ for growth) |
| **Forward P/E** | Custom range |
| **PEG Ratio** | Custom range (\< 1.0 = undervalued relative to growth) |
| **Price Change (%)** | Daily, weekly, monthly, or YTD change range |
| **RSI (14)** | Custom range (\< 30 = oversold, > 70 = overbought) |
| **Dividend Yield** | Minimum yield percentage |
| **Beta** | Custom range (0.5–1.5 typical) |
| **Revenue Growth** | Year-over-year growth rate range |
| **EPS Growth** | Year-over-year earnings growth range |
| **Profit Margin** | Minimum net profit margin |
| **Debt/Equity** | Maximum leverage ratio |
| **Short Interest** | Percentage range of shares sold short |
| **Analyst Rating** | Strong Buy, Buy, Hold, Sell, Strong Sell |
| **52-Week Position** | Within X% of high or low |
**Results Table:**
Matching instruments display in a comprehensive sortable table with all filter fields as columns, plus: current price, AI score, and action buttons (Trade, Add to Watchlist, View Detail).
**Saved Screens:**
Save frequently used filter combinations for one-click access. Examples: "Value Stocks," "High-Growth Tech," "Oversold Dividend Payers."
***
### Performance Calendar
 A visual calendar showing your daily trading performance:
**Color Encoding:**
* **Dark Green** — Highly profitable day (> +2% portfolio return)
* **Light Green** — Moderately profitable (+0.5% to +2%)
* **Grey** — Minimal change or no activity
* **Light Red** — Moderate loss (–0.5% to –2%)
* **Dark Red** — Significant loss (\< –2%)
**Interaction:**
* Hover any day for a tooltip showing: date, P\&L (\$), P\&L (%), number of trades, best trade, worst trade
* Click any day to drill down into the full trade list for that session
* Navigate between months using arrow controls
* Toggle between: This Month, Last Month, Custom Month
**Summary Statistics (Visible Below Calendar):**
* Best day ($ and %), Worst day ($ and %), Average daily P\&L
* Days profitable vs. days unprofitable (ratio)
* Longest winning streak, Longest losing streak
***
### Cash Flow Analysis
A visual calendar showing your daily trading performance:
**Color Encoding:**
* **Dark Green** — Highly profitable day (> +2% portfolio return)
* **Light Green** — Moderately profitable (+0.5% to +2%)
* **Grey** — Minimal change or no activity
* **Light Red** — Moderate loss (–0.5% to –2%)
* **Dark Red** — Significant loss (\< –2%)
**Interaction:**
* Hover any day for a tooltip showing: date, P\&L (\$), P\&L (%), number of trades, best trade, worst trade
* Click any day to drill down into the full trade list for that session
* Navigate between months using arrow controls
* Toggle between: This Month, Last Month, Custom Month
**Summary Statistics (Visible Below Calendar):**
* Best day ($ and %), Worst day ($ and %), Average daily P\&L
* Days profitable vs. days unprofitable (ratio)
* Longest winning streak, Longest losing streak
***
### Cash Flow Analysis
 Comprehensive cash flow visualization:
**Waterfall Chart:**
A step-by-step waterfall showing cumulative cash movements:
* Starting balance (leftmost bar)
* * Trading profits (green bars)
* − Trading losses (red bars)
* − Fees paid (grey bars)
* * Rewards earned (blue bars)
* \= Ending balance (rightmost bar)
**Daily Cash Flow Line Chart:**
* Time-series showing net daily cash inflow/outflow
* Identifies patterns (e.g., consistent fee drain, reward spikes on competition days)
* Moving average overlay to smooth noise
**Summary Metrics:**
* Net trading cash flow (all-time)
* Average daily cash flow
* Largest single-day inflow and outflow
* Total fees as % of total trading volume
***
### Portfolio Rebalance Tool
Comprehensive cash flow visualization:
**Waterfall Chart:**
A step-by-step waterfall showing cumulative cash movements:
* Starting balance (leftmost bar)
* * Trading profits (green bars)
* − Trading losses (red bars)
* − Fees paid (grey bars)
* * Rewards earned (blue bars)
* \= Ending balance (rightmost bar)
**Daily Cash Flow Line Chart:**
* Time-series showing net daily cash inflow/outflow
* Identifies patterns (e.g., consistent fee drain, reward spikes on competition days)
* Moving average overlay to smooth noise
**Summary Metrics:**
* Net trading cash flow (all-time)
* Average daily cash flow
* Largest single-day inflow and outflow
* Total fees as % of total trading volume
***
### Portfolio Rebalance Tool
 Navigate to **Analytics → Rebalance** for systematic portfolio rebalancing.
**Step 1 — Define Target Allocation:**
Set your ideal portfolio allocation by sector, asset class, or individual position weight. For example:
* Technology: 35%
* Healthcare: 20%
* Financials: 15%
* Energy: 10%
* Cash: 20%
**Step 2 — View Current Drift:**
A comparison table shows:
| Sector/Asset | Target % | Current % | Drift | Status |
| ------------ | -------- | --------- | ----- | -------------- |
| Technology | 35% | 42% | +7% | 🔴 Overweight |
| Healthcare | 20% | 12% | –8% | 🟢 Underweight |
| Cash | 20% | 28% | +8% | 🔴 Overweight |
**Step 3 — Review Trade Suggestions:**
The tool calculates specific trades required to restore target allocation:
* "Sell 5 shares of NVDA (\$4,250 proceeds)"
* "Buy 10 shares of JNJ (\$1,580 cost)"
* "Buy 15 shares of XLV (\$2,100 cost)"
**Step 4 — Execute:**
* Execute trades individually (click to open Trading Desk with order pre-filled)
* Execute all at once (batch execution with single confirmation)
Schedule monthly rebalancing reviews. Market movements naturally cause drift from target allocations. Regular rebalancing enforces discipline and prevents unintentional concentration risk.
Navigate to **Analytics → Rebalance** for systematic portfolio rebalancing.
**Step 1 — Define Target Allocation:**
Set your ideal portfolio allocation by sector, asset class, or individual position weight. For example:
* Technology: 35%
* Healthcare: 20%
* Financials: 15%
* Energy: 10%
* Cash: 20%
**Step 2 — View Current Drift:**
A comparison table shows:
| Sector/Asset | Target % | Current % | Drift | Status |
| ------------ | -------- | --------- | ----- | -------------- |
| Technology | 35% | 42% | +7% | 🔴 Overweight |
| Healthcare | 20% | 12% | –8% | 🟢 Underweight |
| Cash | 20% | 28% | +8% | 🔴 Overweight |
**Step 3 — Review Trade Suggestions:**
The tool calculates specific trades required to restore target allocation:
* "Sell 5 shares of NVDA (\$4,250 proceeds)"
* "Buy 10 shares of JNJ (\$1,580 cost)"
* "Buy 15 shares of XLV (\$2,100 cost)"
**Step 4 — Execute:**
* Execute trades individually (click to open Trading Desk with order pre-filled)
* Execute all at once (batch execution with single confirmation)
Schedule monthly rebalancing reviews. Market movements naturally cause drift from target allocations. Regular rebalancing enforces discipline and prevents unintentional concentration risk.